The Writeback extension is continually evolving, and as such, not not all errors have been handled. To get more detailed information on what exactly is going on with the Writeback, and to provide as much information as possible to help with development, a record of the logs can be found in the dev tools.
To access the dev tools there are two ways. You can either press f12 or go into the browser settings > More Tools > Developer Tools. Here you will find a console that will list many settings tabs as follows:
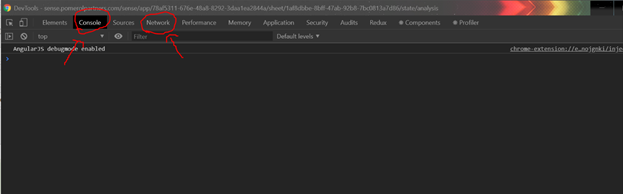
The most important tabs that we want to pay attention to is the Console Tab and the Network Tab.
The Console Tab gives information on the objects currently running in the environment. If there are any compatibility issues with the extension they should appear here. Note: Not all errors that appear here are critical!
The Network Tab will give us detailed information on all the HTTP requests that are sent to and from the webpage. Here we can find out exactly what request the Writeback failed at. If you see any of the requests highlighted in red like the image below that means the request failed and that’s where are problem is.
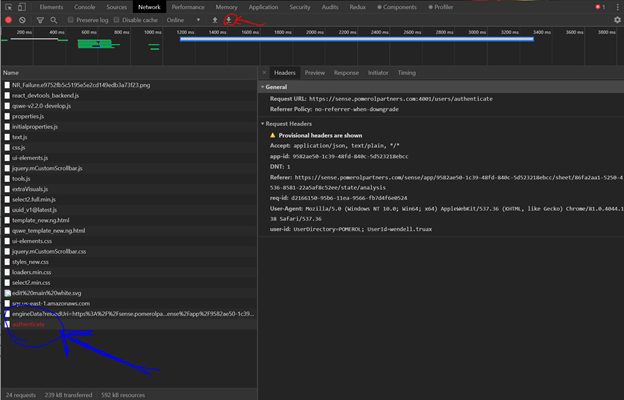
If possible, please include a screenshot of this request and the information related to it in the support ticket.